
In this post, I want to underscore the importance of understanding a statistical analysis section when reading any scientific paper, especially in veterinary medicine where the peer-review process of statistical analysis is not always as strict as in human medicine.
Obviously, it is impossible to cover the entire statistical analysis course in this post, and I am by no means a statistician. However, I will give you an example of choosing a wrong statistical test leading to a completely wrong interpretation of the results of a clinical study. My goal is to ignite your interest and curiosity with respect to statistical analysis, and I plan to continue posting similar articles in the future.
Imagine you are reading a paper that compared the effect of atropine vs. glycopyrrolate on a change of heart rate (HR) in dogs under general anesthesia. This is a completely made-up data, but it serves as a good illustration of possible statistical errors that can be found in the literature.
The authors of this study included 10 dogs in each group, and their main results showed that glycopyrrolate was not different from atropine (Table 1). In the methods, the authors reported that they used a t-test to compare mean values between the groups.
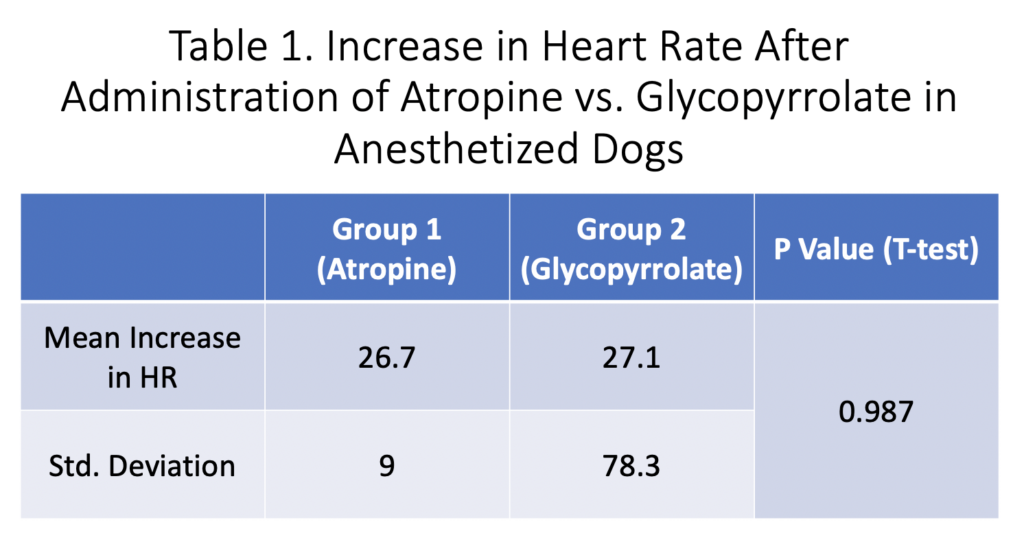
If you are a person who always skips a statistical analysis section or never reads an entire paper, you may conclude that atropine and glycopyrrolate are equal in their effects on heart rate in anesthetized dogs.
To demonstrate that this conclusion is not true based on the results of this made-up study, I am going to dissect these results and will go over a simple mental check list that helps me to ensure that the results were interpreted correctly when I read similar studies (this check list will be different depending on the type of research you are reading).

Below are the questions I ask myself when I read a paper comparing results between the 2 groups:
- Were the baseline characteristics of the study participants similar between the groups?
- What is the outcome variable?
- Is the outcome variable continuous or categorical/binomial?
- Are the observations correlated or independent?
- How many groups or time periods being compared?
- If the outcome is continuous, did the authors test for normality and homogeneity of variances assumptions?
- What statistical test did the authors choose and was this choice correct?
Were the baseline characteristics of the study participants similar between the groups?
It is extremely important that authors report the baseline characteristics of the study participants, and these characteristics ideally should not be significantly different between the groups. If that is true, we know that we are comparing apples to apples and not apples to oranges, which may significantly skew the outcome.
Imagine that the dogs in the atropine group were significantly older, half of them had 3rd degree AV block and some of them were treated with propranolol prior to general anesthesia. On the other hand, the dogs in the glycopyrrolate group were young adults without any comorbidities. In this scenario, the interpretation of the results will be very difficult, because the absence of statistical difference (assuming the stat analysis was performed correctly) may be due to the fact that patients in the atropine group had underlying pathologies that prevented them from responding to atropine due to structural defects (e.g. 3rd degree AV block) . This example is very exaggerated, but I hope that you got the idea. In general, there is a way to control for these baseline differences by doing a regression analysis and adjusting for confounders, however this type of discrepancies at the baseline will make the results of a study less valid.
What is the outcome variable and Is the outcome variable continuous or categorical/binomial?
In this paper, the main outcome was heart rate which is considered a continuous variable. Alternatively, you may encounter binary/binomial or categorical variables. A categorical variable is a variable that can take on one of a limited, and usually fixed, number of possible values, assigning each individual or other unit of observation to a particular group or nominal category on the basis of some qualitative property (Yates et al.). A categorical variable that can take on exactly two values is termed a binary variable or a dichotomous variable (https://en.wikipedia.org). In medicine, an example of binary variable may be dead/alive or male/female.
Are the observations correlated or independent?
Correlated vs. independent data will change the choice of statistical test and, if it is not taken into account, may result in inappropriate P value. Correlated observations are when pairs of observations are related and more similar to each other than to other observations in the dataset. For example, if a study dog receives atropine multiple times at different time points, this data will be correlated because it is obtained from the same dog. In our example, there was a a comparison between completely independent groups of dogs that were not related to each other.

How many groups or time periods being compared?
This is another consideration when choosing a statistical test. In our example there were only two groups. However, if we were to compare 3 or more groups, we might have chosen a different statistical test (e.g. ANOVA or Kruskal-Wallis).
If the outcome is continuous, did the authors test for normality and homogeneity of variances assumptions?
In our example paper, the authors reported mean values of a continuous variable (HR) in the atropine vs. glycopyrrolate groups. It is important to realize that continuous variable may be reported as mean +/- standard deviation (SD) or as median +/- interquartile range (IQR) or range. The data with normal distribution (bell-shaped) is usually presented as mean +/- SD vs. non-normally distributed data as median +/- IQR. The main reason in having this distinction is that non-normally distributed data (right- or left-skewed, with or without outliers) will result in significant deviation of the mean which will not represent the sample dataset correctly.
There are several ways to test for normality of your dataset:
- Look at histograms – does it appear bell shaped?
- Look at a normal probability plot – is it approximately linear?
- Look at descriptive statistics – are the mean and median similar?
- Run formal tests of normality (e.g. Kolmogorov-Smirnov) – highly influenced by sample size.
Obviously, when you are reading a paper, you won’t have access to the raw data to check for normality, however it is important that authors report that they did assess their data for normality in the stat section and, ideally, the dataset should be presented in the paper in the form of box plot or histogram, which will allow readers to eyeball the distribution of the data by themselves.
Testing for homogeneity of variances assumption may be not as important because majority of linear models (t-test, ANOVA, linear regression) are robust against this assumption, particularly if sample sizes in the groups are similar. However, if you are dealing with small sample sizes and they are not equal in size (e.g. 5 dogs in one group and 12 groups in another group), this assumption may be more important. Homogeneity of variance assumes that the population variances (i.e., the distribution, or “spread,” of scores around the mean) of two or more samples are considered equal. This assumption can be assessed by looking at values of variance/standard deviation, plots and formal tests of homogeneity.
What statistical test did the authors choose and was this choice correct?
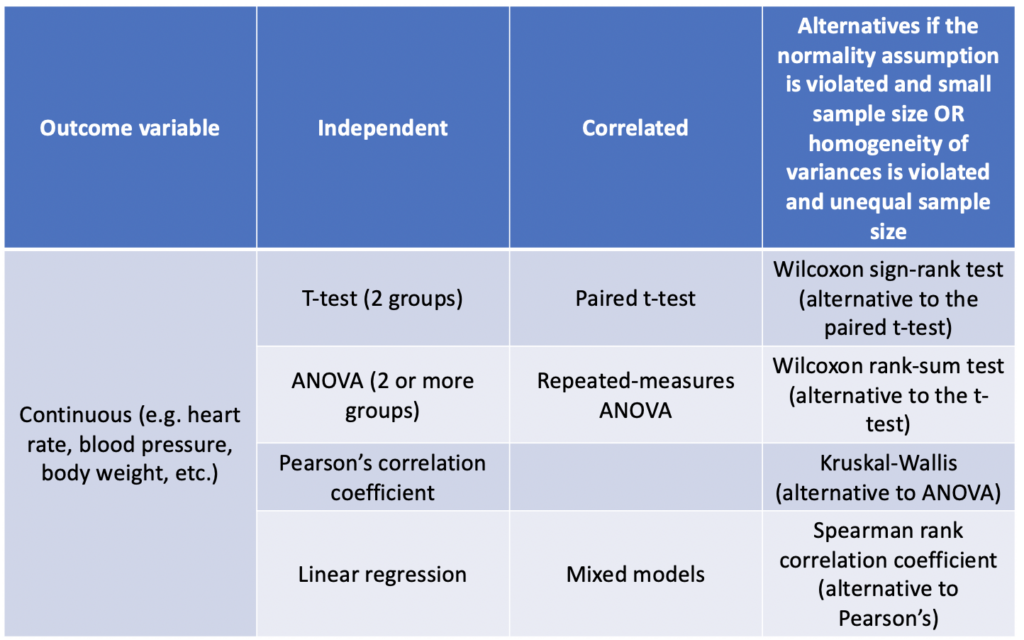
In our example, the authors ran a t-test to compare the change in HR between the groups after study dogs received either atropine or glycopyrrolate. Before we decide if their choice was appropriate, I will give you a tool (Table 2) that allows you to pick the correct statistical test depending on the factors we discussed above.
Now, let’s analyze the authors choice and decide if it was appropriate.
- Were the baseline characteristics of the study animals similar between the groups?
For the sake of this discussion, let’s say that both groups were similar at the baseline and only young healthy dogs were recruited in this study.
- What is the outcome variable?
Heart rate.
- Is the outcome variable continuous or categorical/binomial?
Continuous.
- Are the observations correlated or independent?
Independent.
- How many groups or time periods being compared?
Two groups.
- If the outcome is continuous, did the authors test for normality and homogeneity of variances assumptions?
The authors did not report this information, but we kindly asked them to provide it. Let’s take a closer look at what they got (Graph 1 and 2).
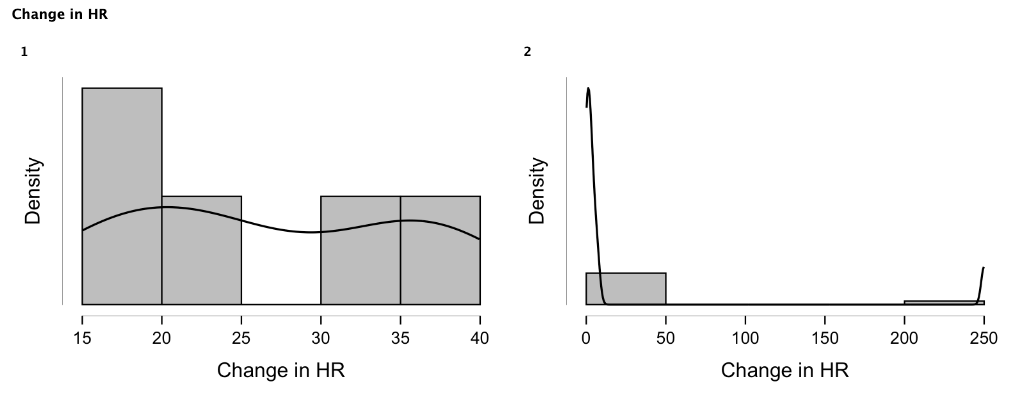

If you look at the histogram and box plots above, you will be able to evaluate the distribution of the observations in both groups. Clearly, the data is not normally distributed (does not remind bell shape on the graph 1), and the reason the mean values are similar is largely due to the presence of one extreme outlier with the HR change of 250 in the glycopyrrolate group 2.
- What statistical test did the authors choose and was this choice correct?
Based on the fact that data was not normally distributed and the sample size was small, the authors should have reported median values and should have run a Wilcoxon rank-sum test which is a non-parametric alternative to the t-test.
Let’s see what results they would have gotten if they did it correctly: Below you will find the updated results (median with IQR) and a new P value (Wilcoxon rank-sum test) as depicted in the table 3.
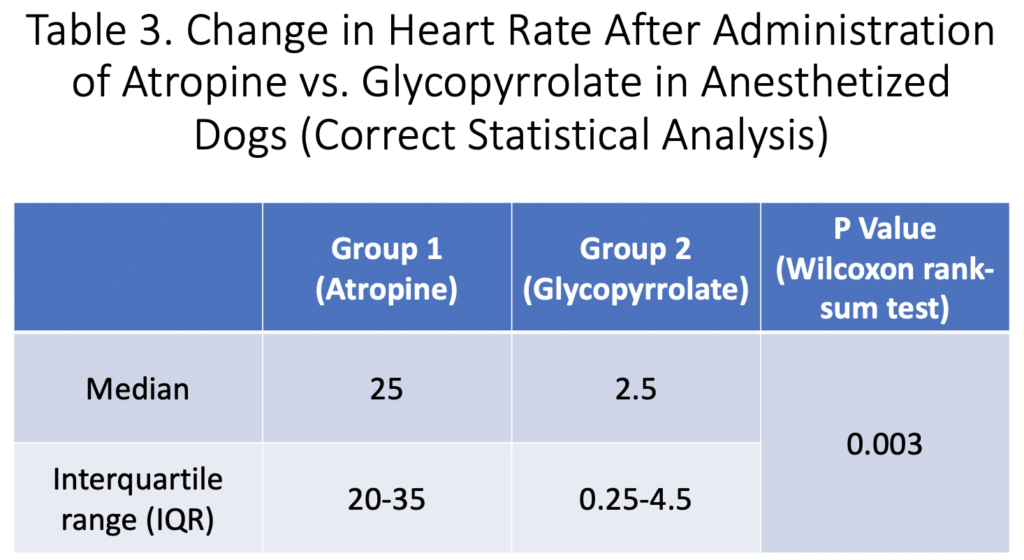
As you can see, the Wilcoxon rank-sum test and median values revealed a statistically significant increase in heart rate in the atropine group vs. glycopyrrolate group.
The Bottom Line
- I think we should pay more attention to the statistical analysis and methodology of the scientific papers we read. This will enhance our critical thinking and will greatly improve our understanding of current research and, what is more important, will prevent us from having a blind faith in the interpretation of the results offered by authors that is inherently prone to errors.
- There are available online courses and textbooks that may improve your understanding of statistical analysis in veterinary medicine. Personally, I found an asynchronous online course by Standford University on medical statistics extremely useful.
- All stats for this post were done in JASP which is a free statistical analysis software that can be downloaded here.
References
Yates, Daniel S.; Moore, David S.; Starnes, Daren S. (2003). The Practice of Statistics (2nd ed.). New York: Freeman. ISBN 978-0-7167-4773-4